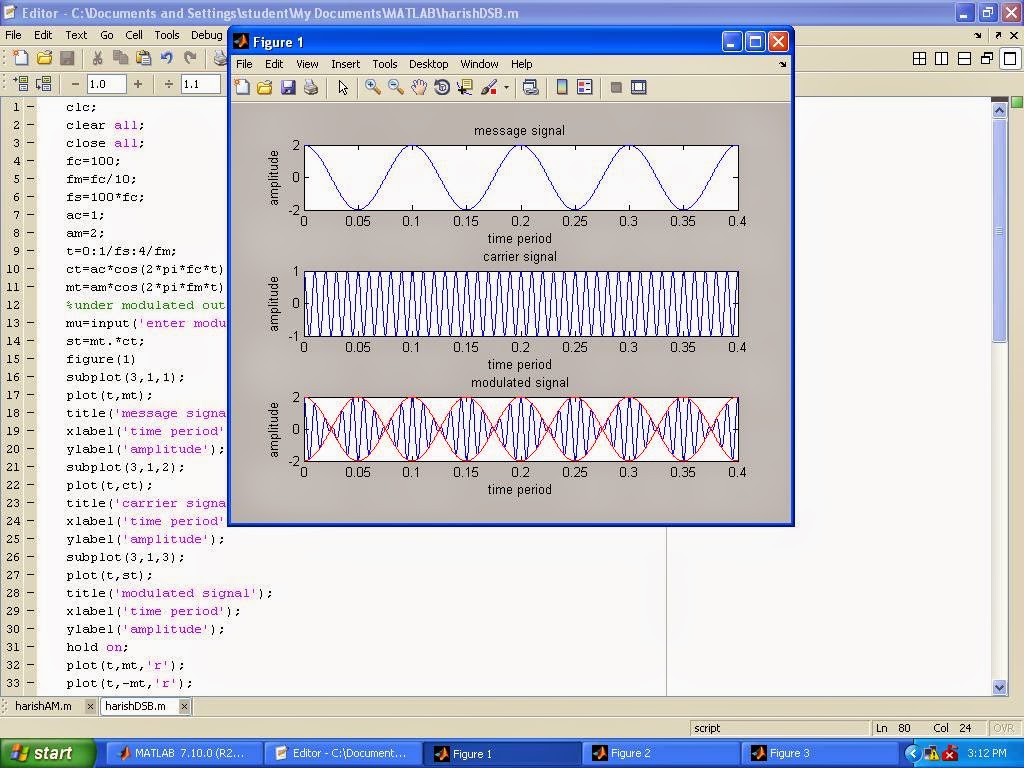
clc;
clear all;
close all;
fc=100;
fm=fc/10;
fs=100*fc;
ac=1;
am=2;
t=0:1/fs:4/fm;
ct=ac*cos(2*pi*fc*t);
mt=am*cos(2*pi*fm*t);
%under modulated output
mu=input('enter modulation index:');
st=mt.*ct;
figure(1)
subplot(3,1,1);
plot(t,mt);
title('message signal');
xlabel('time period');
ylabel('amplitude');
subplot(3,1,2);
plot(t,ct);
title('carrier signal');
xlabel('time period');
ylabel('amplitude');
subplot(3,1,3);
plot(t,st);
title('modulated signal');
xlabel('time period');
ylabel('amplitude');
hold on;
plot(t,mt,'r');
plot(t,-mt,'r');
hold off;
%spectrum
mt_frequency=fftshift(abs(fft(mt)));
f1=-fs/2:fs/(length(mt_frequency)-1):fs/2;
figure(2)
subplot(3,1,1);
plot(f1,mt_frequency);
title('message signal');
xlabel('frequency');
ylabel('amplitude');
axis([-150 150 0 2000])
ct_frequency=fftshift(abs(fft(ct)));
f2=-fs/2:fs/(length(ct_frequency)-1):fs/2;
subplot(3,1,2);
plot(f2,ct_frequency);
title('carrier signal');
xlabel('frequency');
ylabel('amplitude');
axis([-150 150 0 2000])
st_frequency=fftshift(abs(fft(st)));
f3=-fs/2:fs/(length(st_frequency)-1):fs/2;
subplot(3,1,3);
plot(f3,st_frequency);
title('modulated signal');
xlabel('frequency');
ylabel('amplitude');
axis([-150 150 0 2000])
%demodulation
dt=st.*ct;
dt_frequency=fftshift(abs(fft(dt)));
filter=fir1(200,fm/fs,'low');
original_t_signal=conv(filter,dt);
original_f_signal=fftshift(abs(fft(original_t_signal)));
t1=0:1/(length(original_t_signal)-1):1;
f4=-fs/2:fs/(length(original_f_signal)-1):fs/2;
figure(3)
subplot(2,1,1);
plot(t1,original_t_signal);
title('time domain signal');
xlabel('time period')
ylabel('amplitude');
subplot(2,1,2);
plot(f4,original_f_signal);
title('frequency domain signal');
xlabel('frequency')
ylabel('amplitude');
axis([-150 150 0 2000])
WHEN mu=1


mu does not seem to be used. Is that a typo in the code?
ReplyDelete